@casinovarock23
I actually have the older XW+ units and the batteries are the 48v LL v1 and v2 units with a v2 unit acting as the "cluster" master. While there was LOTS of trouble getting closed loop coms going with my Insight Facility device, EG4 eventually got a working firmware (this was a little over 1 year ago). Being that the wall units are newer I would hope EG4 would have closed loop coms with Schneider working properly out of the box.
Since getting closed loop working I have been very happy with the setup overall. One thing to note is that while I do have closed loop coms working, the "BMS Setup" part of the Insight Facility doesn't work properly for me and actually causes more issues. The issue could be that I'm using XW+ units which Schneider has pretty much stopped supporting in favor of the XW Pro. I do have 3x MPPT 100 charge controllers connected to the system and the "BMS Setup" integration for those has not worked properly either.
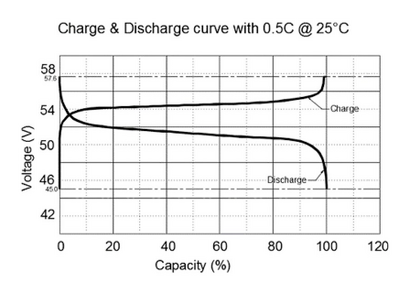
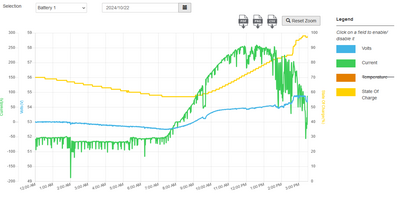
Since the "BMS Setup" within Insight Facility (I.F) isn't working properly with my setup I am having to manage 95+% charge states via voltage instead of SOC. I have the latest facility FW and have been waiting for quite some time for a new version with the hopes that it will fix some of the BMS issues.
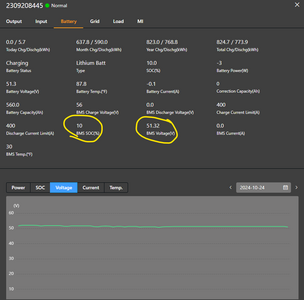
Pretty much the issues that Im having with the I.F. BMS integration is nothing is properly adhering to SOC settings or will randomly do something based on SOC but not consistently, the MPPT units have a setting to sync their voltage with BMS voltage readings for charging vs using their voltage reading which appears to not work with my system. The BMS regularly has a .5 - 1.5v variance from what the MPPT report which is a bit of an issue when trying to get all 36 batteries fully topped up to 100% SOC (resistance from all the copper involved and the more amps pushed the greater the variance) so I have had to set the bulk/absorb voltage slightly higher than the recommended charge voltage and manually baby sit the 100% SOC top up days (which is something that happens every few weeks). Even though the I.F. has SOC settings for the inverters I think only the XW Pro units are actually supported, so you might have some luck with that if you are running XW Pro units. A few years ago Schneider did something with their support department which has made high level trouble shooting a nightmare (the last ticket I put in I was actually teaching the tech new things and never got a resolution other than finally getting a developer acknowledgement that I have found a bug that has been ongoing for almost a year with no resolution) so I have not tried putting in a ticket for this BMS integration issue and have used my home automation system with scripting to help work around the issues.
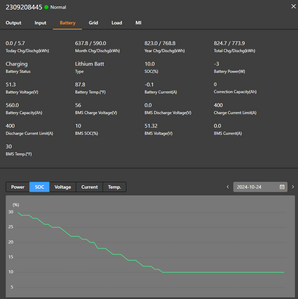
After getting a working FW from EG4, integration with the I.F. was very straight forward following the instructions in the battery manual. For me the closed loop BMS integration gets overall SOC readings into the I.F. unit where I can then pull that via modbusTCP into my automation system to then tweak inverter (or charge controller) settings via scripts in somewhat real time.
Feel free to holler if you have any questions or need any help. Even though the closed loop integration is not fully working as designed for my setup, I am still VERY happy with these EG4 batteries vs my old NiFe battery. I fully believe the issues I am having have with the BMS integration has to do with Schneider and not EG4 at this point. (aside from a high amp reporting issue that I have brought up to EG4 through multiple avenues and have never gotten a response or even an acknowledgement to the issue.)
J


